| View unanswered posts | View active topics |
It is currently Fri May 10, 2024 4:39 pm |
|
All times are UTC - 6 hours [ DST ] |
|
|
Page 1 of 6 |
[ 57 posts ] | Go to page 1, 2, 3, 4, 5, 6 Next |
| Print view | Previous topic | Next topic |
Incoming gamma radiation
| Author | Message |
|---|---|
|
Joined: Sat Feb 01, 2014 3:46 pm Posts: 46 |
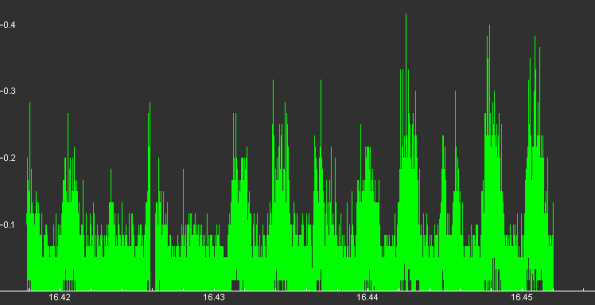 This is an image made from the sd card-saved data from our LND714 gamma tube operating at 500VDC sticking partly outside through a hole in the windowframe. The bottom scale is in years and tenths for all of June so far. The left scale is in Bq (CPM / 60) -Peter Febbroriello longitude:-73.138866 , latitude: 41.789325 phone 860-482-6606 |
| Tue Jun 14, 2016 6:17 pm |
|
|
Joined: Sat Feb 01, 2014 3:46 pm Posts: 46 |
This is what I now believe is happening. When Satellite Kosmos 2251 debris and debris from IRIDIUM 33 passes directly overhead or within about 100 miles (orbit track on land vs gamma tube location) it is possible to see counts rise from 1 cpm to over 20 cpm, and drop rapidly when the satellite passes over. The strongest counts have been in April-May-and June for the last two years, probably when all the orbits of all the debris favors my location.
To you folks sampling from other locations there may be seen on some of your graphs, a large rise and fall on particular days, with no convenient explanation, plumes, spill etc don't seem to be the cause. Try looking at: http://science.nasa.gov/iSat/iSAT-text-only/ and http://www.n2yo.com/?s=25544 and see if your count pattern matches some of the debris as they pass over your site. There must be a large haze of fine radioactive particulates in the orbital track which keeps the background level elevated as well, punctuated by spikes as hot chunks make up the debris. There is one more satellite, SNAP 10A that is also spewing hot chunks, but no location or orbital data is available. It is possible that Kosmos junk smashed into the SNAP-10 satellite, and we now see three satellites' debris fields all superimposed. I am collecting data and will attempt a mathematical approach to analysis using data from the tracking sites. |
| Tue Jun 14, 2016 8:06 pm |
|
|
Moderator  Joined: Mon Jan 28, 2013 7:40 pm Posts: 2885 Location: Illinois |
peter febbroriello wrote: ...plumes, spill etc don't seem to be the cause. I disagree! I have followed EPA RadNet graph patterns from Washington (Hanford or Fukushima) to my outside monitoring station here in Illinois. I've also detected elevated radiation levels on my outside radiation station that happen around the time my local nuclear plant shuts down a reactor and depressurizes (atmospheric steam dump) during a refueling outage. I've also detected elevated readings that occurred the same time Canada's forest fires covered my area and our U.S. governments AirNow.gov website showed air quality concerns for my area. This was likely radiation from Fukushima that settled in Canada and got redistributed during the forest fires. Years ago using my InspectorEXP in my house 24/7 I detected clear elevated readings when the hurricane winds reached Illinois over a day after hurricane Sandy caused Oyster Creek and another nuclear plant to to SCRAM. I will not rule out your suggestion just yet as one of many possible causes of elevated readings, but your blanket statement above does cause me concern as to how valid your statements might be. I believe there are many actual factors involved. _________________ MY OUTSIDE RADIATION MONITORING STATION: South Beloit, Illinois - GMC200 Outside on HEPA air purifier, ground level, facing West. http://netc.com/chart/view.php?n=1%3AEB5A139C |
| Wed Jun 15, 2016 7:53 am |
|
|
Joined: Sat Feb 01, 2014 3:46 pm Posts: 46 |
Sorry, I didn't mean to be blankety. Thought that "To you folks sampling from other locations there may be seen on some of your graphs, a large rise and fall on particular days, with no convenient explanation, plumes, spill etc don't seem to be the cause." would put my hypothesis in the "last-resort" category. But I do tend to be a bit terse.
The LND714 is not particularly sensitive, and the normal background is 1 or 2 cpm. The readings from the heavens appear to max out at 22 cpm. I am counting for 60 seconds and storing the total count for that minute, So the data resolution is remarkable. I'm still taking data and will save the analysis until later. |
| Wed Jun 15, 2016 1:04 pm |
|
|
Joined: Fri Jul 03, 2015 7:04 pm Posts: 164 Location: Toronto Canada |
Well, hot satellite debris is an interesting hypothesis. Getting spikes at a 100 mile distance when it passes would mean very hot indeed, assuming an isotropic Gamma radiation pattern. But it is possible, and estimates without analysis are not scientific. One way to test this would be to shield a GM tube in a lead pipe or cylinder, aim it skyward and see if the readings spike at the expected times. One would have to get the setup's "cone of sensitivity" based on pipe length, tube size/shape etc. and some point source testing, but I think that could definitively prove or disprove an orbiting radiation source.
_________________ https://netc.com/chart/view.php?n=1%3A919A925A.5 Toronto, Ontario, Canada SBM-20 indoors |
| Wed Jun 15, 2016 11:27 pm |
|
|
Joined: Sat Feb 01, 2014 3:46 pm Posts: 46 |
I have a 2 inch Alpha Beta Gamma pancake (LND7311 700Volts) sitting inside a 1/4 inch thick walled 7.5cm x 11.0cm x 13.0cm deep lead box. After I read Bert's post I took out the last sample and left the lid off the box giving me a rectangular solid angle to work with, pointing straight up. The long dimension is oriented N/S. This should mark out a fairly large amount of space real estate at 300-800 miles out.
Within a few seconds of counting, a large spike of 85 cpm appeared out of a background of 35 cpm, where before with the lid on, it was about 30 cpm. i will keep this running 24/7 for a while and see how many hits are from directly overhead. My other data gathering is not showing anything that can be used to pin blame on any of the satellites I mentioned above, except for the SNAP 10. Since no orbital data is available, and NASA does not seem to be tracking it, the only thing I can say for now is that the data can be explained by multiple orbiting gamma sources of unknown origin clustered alongside other known debris. I'm a bit worried that orbital decay will bring large amounts of very radioactive stuff into the upper atmosphere, and maybe to ground. |
| Tue Jun 21, 2016 2:20 pm |
|
|
Joined: Sat Feb 01, 2014 3:46 pm Posts: 46 |
COSPAR 2006 PEDAS1-0002-06
Identification of a debris cloud from the nuclear powered SNAPSHOT satellite with Haystack radar measurements C. Stokely1 and E. Stansbery2 1Barrios Technology, Texas, USA, 2NASA Johnson Space Center, Houston, Texas, USA Abstract From information found in this paper, I can confirm that the satellite we are observing via gamma emission, is indeed the SNAP-10. The key is in the annual observation periods shown in fig. 6 matching exactly with one of my plots. http://ntrs.nasa.gov/archive/nasa/casi.ntrs.nasa.gov/20060028182.pdf The altitude of the debris is between 1200 and 1400 kilometers. From the inverse square law and a count of 30CPM i calculate 845000 Bq at the source. |
| Wed Jun 22, 2016 1:58 pm |
|
|
Joined: Fri Jul 03, 2015 7:04 pm Posts: 164 Location: Toronto Canada |
That's a nice setup, Peter. Using the dimensions of your box, I would expect increased readings for a 3 minute duration every time the satellite passes more or less overhead (within 440 km East or West of your longitude). Using the 10 day predictions on the website you mentioned, http://www.n2yo.com/satellite/?s=1314 it seems only the "excellent" and the adjacent "good" local passes would be within the view of this detector, so times should be predictable.
Here's how I calculated (in case it's not right!). Assuming sensor height of 2 cm from the bottom of the box, depth of detector is 11 cm. With N-S dimension of 11 cm, the N-S visible range at 1300 km altitude is 1300 km. Orbit circumference is 48,167 km so fraction of orbit time overhead is 0.027. Orbit is 111 minutes so this 1300 km part will take 3 minutes. Visible E-W width of 880 km is based on 7.5 cm box width. It may not be exact but should be close. _________________ https://netc.com/chart/view.php?n=1%3A919A925A.5 Toronto, Ontario, Canada SBM-20 indoors |
| Wed Jun 22, 2016 10:17 pm |
|
|
Joined: Sat Feb 01, 2014 3:46 pm Posts: 46 |
Thanks, Bert...I built it with a Freescale MCF51QE128 processor using the interrupt mode to capture GM tube pulses. The DEMOQE designer boards are available complete on Ebay for under $50. I added a small daughter card that holds an SD card mount and an EMCO Q10-5 high voltage converter. It can run off of batteries or a six volt DC wall plug and has an interface from PE Micro that provides a data stream readout and a plot. I can monitor the screen via network and RDP (remote desktop).
Attachment: june.png [ 3.54 KiB | Viewed 110123 times ] Plot for June from the window frame mounted LMD714 gamma tube. it has an identical support package. Yesterday's spike is on the far right. |
| Thu Jun 23, 2016 11:13 am |
|
|
Moderator Joined: Mon Jan 28, 2013 7:40 pm Posts: 2885 Location: Illinois |
_________________ MY OUTSIDE RADIATION MONITORING STATION: South Beloit, Illinois - GMC200 Outside on HEPA air purifier, ground level, facing West. http://netc.com/chart/view.php?n=1%3AEB5A139C |
| Thu Jun 23, 2016 12:42 pm |
|
|
|
Page 1 of 6 |
[ 57 posts ] | Go to page 1, 2, 3, 4, 5, 6 Next |
|
All times are UTC - 6 hours [ DST ] |
Who is online |
Users browsing this forum: No registered users and 25 guests |
| You cannot post new topics in this forum You cannot reply to topics in this forum You cannot edit your posts in this forum You cannot delete your posts in this forum You cannot post attachments in this forum |